As a Tignis team member, I can say I am always excited and surprised with the tools put together by our team. Internally, these tools have helped us deliver incident reports to our customers to save them time by quickly guiding their attention to incidents of interest. One such tool, Tignis’s interactive data analysis application powered by DTQL, has become so compelling that it now stands out in its own right. DTQL stands for Digital Twin Query Language because it leverages the interaction between physical components or assets in a system or process and then navigates relationships to strengthen analysis techniques.
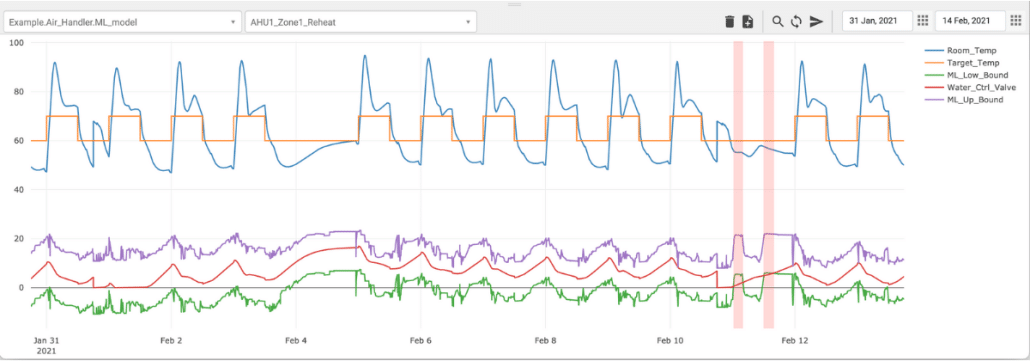
The exciting news for you is that we are releasing this previously internal-only functionality for use by any team looking to get advanced analytical value out the sensor data from their physical equipment. We are already seeing strong interest from automation teams and maintenance teams. Tignis’s analysis application powered by DTQL is a line-by-line interpreter and graphing explorer that allows rules to be declared using logic, mathematical, statistical, or ML functions, the results of which can be plotted or used to create highlighted portions of interest. I have had a very pleasant and illuminating experience with this tool, including continuous surprises with its capabilities, and amazement at the anomalies it picks up that would have otherwise escaped me. I think this application would be of immediate help to many people. Allow me to tell you why I love it so much.
Currently, many maintenance teams are using Excel as a tool for data analysis. Don’t get me wrong, Excel has its place in the world and is an impressive tool in its own right. However, for data analysis it can be a bit cumbersome: wait for the program to load all your data, make sure you have selected appropriate rows or columns, deal with missing or incorrect data, find and navigate to the plotting feature, ensure correctness of the settings used to plot your data, select more rows and columns, and visualize with graphs that have pre-configured time ranges with little ability to navigate within them or zoom in/out. Additionally, all of the preceding issues get repeated for every analysis you want to do, there are data limitations on top of this, and lastly data formatting issues can be experienced when you export to csv or during a data import. All of these issues go away with Tignis’s analysis application.
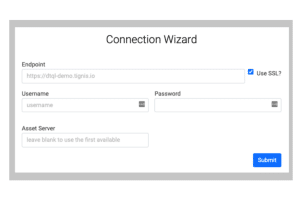
Tignis’s analysis application powered by DTQL aims to connect to existing infrastructure. The application was initially developed to be used exclusively by Tignis team members on Tignis’ platform, but we have also recently added an abstraction interface that allows us to create connectors to pull data in from other sources. Presently, the interpreter can pull data from CSV files and OSISoft Pi servers, but we plan to expand to more data sources in the future. Our aim here is to make it easy to work with your data. In the case of Pi, you can simply specify your server connection details and Tignis takes care of the rest.


